
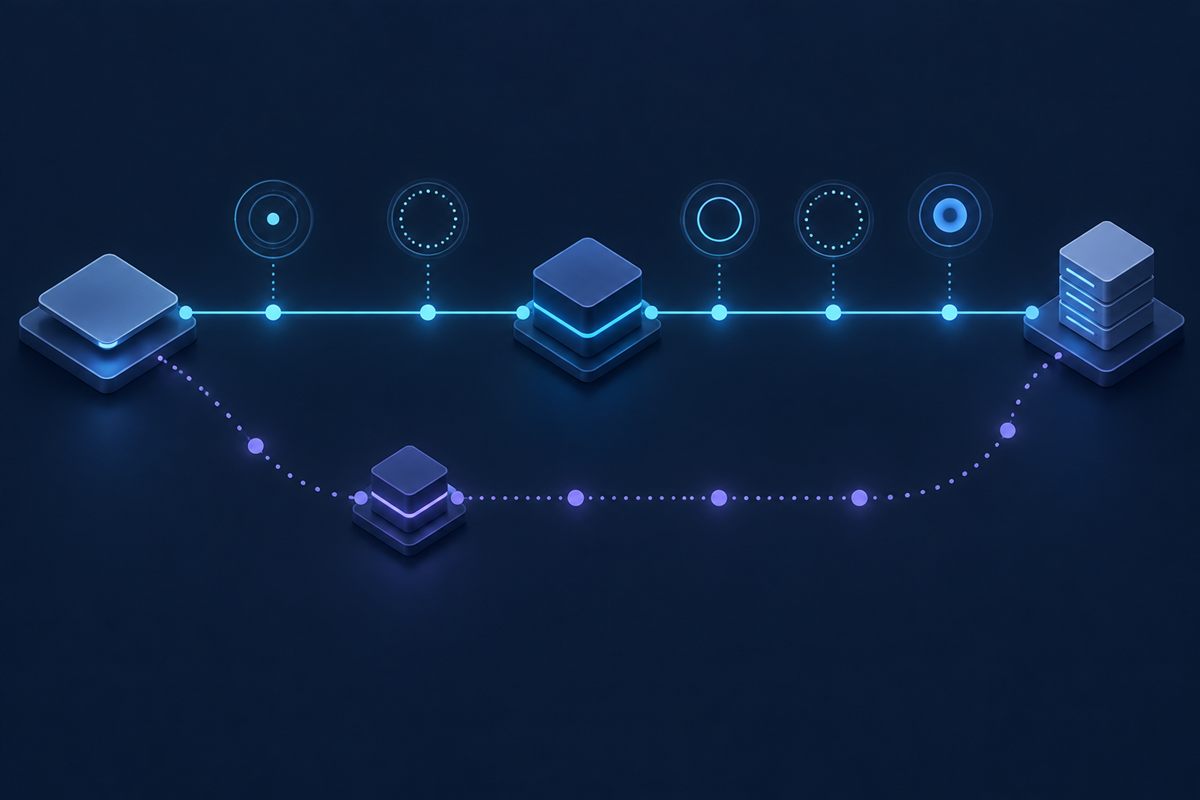
Monitor a proxy as a chain of observable stages: resolve and connect to the gateway, authenticate, establish any tunnel, validate destination TLS, receive the first byte, and confirm an expected response. Give every probe a finite budget, store stage-specific outcomes and latency distributions, alert on sustained evidence rather than one sample, and fail over only to a pre-tested route with a reversible return plan.
Scope: this guide covers neutral and application-aware health checks, timeout stages, latency summaries, failure classification, bounded retries, consecutive-failure policies, and proxy failover. It does not promise a numeric uptime level, replace destination monitoring, authorize synthetic traffic, or define a universal service-level objective. The Proxy Testing and Troubleshooting hub links to related diagnostics.
Define what proxy uptime means for the workload
A listener accepting a TCP connection is not the same as an application request succeeding. The gateway can be reachable while authentication fails, CONNECT is denied, destination DNS fails, TLS cannot validate, or the target returns an error. Conversely, one destination outage can make a healthy proxy appear unavailable. Measure the chain and name the boundary.
Use three result families. Proxy availability covers reaching and authenticating to the gateway. Route availability covers tunneling or forwarding through it while preserving DNS and TLS expectations. Application availability covers the destination’s own status and content contract. Report them separately so the on-call engineer knows which owner and fallback are relevant.
Write the monitoring objective before choosing intervals. Identify critical regions, protocols, address families, destinations, session behavior, maintenance windows, acceptable detection delay, and recovery owner. A number labeled “uptime” without probe location, target, timeout, and success rule is not comparable across systems.
Build health check design in layers
Begin with a neutral endpoint you own or are authorized to probe. It should provide a small deterministic response, support the same transport used by the workload, and avoid side effects. A route-check endpoint may also return the source address it observes, allowing the monitor to distinguish success through the assigned exit from unexpected direct access.
Add one lightweight application-aware check only when the destination permits it. Choose a read-only URL or documented health method and validate a stable response property rather than a broad 2xx rule. A login page, rate-limit response, captive portal, or generic error can still produce an HTTP response, so status alone is not always success.
The Prometheus blackbox exporter README illustrates black-box probes across HTTP, HTTPS, DNS, TCP, ICMP, and gRPC, exposes a probe success metric, and provides timing data. The tool is one implementation option; the monitoring model should remain portable and should protect probe credentials, target configuration, and debug output.
Assign explicit timeout stages
Separate DNS resolution, gateway connection, proxy authentication or tunnel negotiation, TLS handshake, first byte, body validation, and total probe time. Not every client exposes each phase, but the model still prevents one generic timeout from erasing evidence. Record the most specific stage available and the complete elapsed time.
Choose a total timeout shorter than the probe interval so checks do not accumulate. Leave room for metrics scraping, queue delay, and a small retry only when one is justified. A monitor whose timeout equals its interval can create overlapping requests during an outage and turn observation into load.
Use the same certificate and hostname verification as production. RFC 9110 describes HTTPS service identity verification and HTTP method properties. A monitor that suppresses TLS errors can report green while the real client correctly refuses the route.
Measure latency distribution, not one average
Retain enough observations to calculate a median and upper-tail percentiles over a documented window. The median represents a typical check better than a mean distorted by a few extreme samples. Tail latency reveals intermittent DNS, connect, tunnel, TLS, or destination delays that users can feel even while most probes are fast.
Segment latency by route label, probe location, destination, protocol, address family, and stage. Never combine several regions or endpoints into one distribution unless that aggregate answers a defined question. A slow distant probe may be healthy for its path while hiding a local regression elsewhere.
Do not invent thresholds from a generic article. Establish a baseline under expected load, then choose warning and critical conditions that match application budgets. Review thresholds after route, destination, or workload changes. Publish the window and sample count next to every percentile.
Use explicit failure classification
| Observation | Class | Likely owner or next check |
|---|---|---|
| Proxy hostname cannot resolve | Gateway DNS | Resolver and endpoint configuration |
| Connection refused or timed out | Gateway reachability | Network path, listener, firewall, and connect budget |
| HTTP 407 | Proxy authentication | Gateway account, secret rotation, and auth method |
| Tunnel denied | Proxy policy | Destination port and account permissions |
| TLS validation failure | Trust or tunnel | Hostname, issuer, expiry, and inspection layer |
| HTTP 429 | Destination pacing | Reduce request rate and honor destination guidance |
| Wrong source address | Route integrity | Assignment, pool change, bypass, and failover state |
RFC 6585 defines 429 as a rate-limiting response and allows a server to include Retry-After. Treat it as destination feedback, not proof that the proxy is down. The server may also drop connections under load, so classification should consider destination context rather than rely on one status.
The common proxy errors guide provides a wider diagnostic map. Monitoring labels should use the same vocabulary as incident tickets so an alert does not need translation before action.
Use bounded retries without hiding incidents
Bounded retries require a small maximum, an overall deadline, backoff, jitter, and eligible failure classes. A single retry can distinguish a brief network interruption from a sustained failure, but the original observation must still be counted. If dashboards retain only the successful retry, the system will look healthier while instability grows.
RFC 9110 distinguishes idempotent methods and warns against automatically retrying non-idempotent requests without additional knowledge. Health checks should normally use safe, read-only methods. Do not retry authentication failures, certificate errors, invalid configuration, explicit policy denials, or content mismatches as if they were transient.
Respect destination pacing. If a 429 supplies usable retry guidance, the application or monitor should slow according to policy; it should not rotate to another proxy to evade the limit. The monitor’s purpose is to observe availability at low impact, not to manufacture a successful response.
Alert on sustained and corroborated evidence
One failed probe can reflect packet loss, deployment transition, or a brief destination event. Require a documented count of consecutive failures or a failure ratio across a short window before paging, unless the failure is a high-confidence route-integrity or security event. Use separate warning and critical states when operations need time to investigate before failover.
Corroborate from more than one probe location only when those locations represent real clients. If all regions fail the neutral route check, proxy or shared destination infrastructure is more likely. If one region fails while another passes, investigate the regional path. If neutral checks pass but the application target fails, avoid switching proxies before checking destination health.
Deduplicate alerts by route and incident while preserving stage detail. Include first failure time, last success, affected monitors, current consecutive count, redacted route label, target category, stage, and runbook. Never include a complete credential-bearing URI or response body.
Make failover prepared, bounded, and reversible
A standby route is usable only after it has passed the same neutral, TLS, source-address, and application checks. Preconfigure authentication, destination allowlists, location expectations, monitoring labels, and capacity. Testing the backup for the first time during an outage adds unknowns at the worst moment.
Trigger automatic failover only after the chosen evidence threshold and a healthy standby signal. Add hysteresis so alternating probe results do not flap traffic between endpoints. Cap failover attempts and stop if both routes fail; repeated switching can multiply requests and obscure the shared destination problem.
Define return-to-primary criteria separately. Require sustained primary health, a stable route address, and a controlled canary before moving all traffic back. Record the transition and compare error rate and latency. Manual approval can be safer for stateful or allowlisted workloads even when detection is automatic.
Review probe cost and observability failure modes. A monitor can report silence because its own scheduler, credentials, resolver, metrics path, or storage failed. Track probe freshness, configuration load success, queue delay, and the monitoring system separately from target results. Use an independent dead-man signal for missing observations, and test that maintenance suppression expires. Estimate request volume as locations multiplied by targets, routes, address families, retries, and intervals; keep the total within the permission and rate budget of each endpoint. Retain raw samples long enough to investigate incidents, then aggregate or expire them according to data policy. This makes monitoring trustworthy without creating unnecessary destination load.
A successful health probe does not settle destination reputation. Use the proxy IP reputation guide for a small, authorized acceptance sample, and retain those destination-specific results separately from transport availability.
Verify the monitor before trusting it
- Record the probe version, location, route label, endpoint, protocol, family, intervals, and budgets.
- Confirm a healthy primary reports the expected source address and content contract.
- Use a controlled method to make one stage fail without weakening TLS or touching unrelated traffic.
- Confirm the alert reports the correct stage and retains the first failure.
- Restore the stage and verify recovery timing.
- Test the pre-authorized standby at low volume.
- Exercise the failover threshold and stop condition in a maintenance window.
- Verify return-to-primary and audit evidence.
Expected observation: healthy checks identify the assigned route and valid destination response; controlled failures appear in the correct stage; latency summaries retain their labels and window; alerts require the documented evidence; and failover moves only to a currently healthy standby before a verified return.
Use the proxy verification guide to establish the initial route evidence. Monitoring should continuously apply that contract without turning one public echo service into a single point of truth.
Operational limits: synthetic probes sample selected paths at selected times. They can miss failures between intervals and cannot prove all client locations, sessions, destinations, or workloads are healthy. A proxy success does not guarantee destination success, and a destination failure does not automatically justify proxy failover. Pair probes with real application indicators and incident review.
Choose monitoring and route capacity together
Document the primary and standby protocols, locations, authentication, session behavior, concurrency, transfer estimate, neutral target, application target, probe interval, timeout budget, alert threshold, and recovery owner. Compare those requirements with current Mexela proxy pricing and confirm testable inventory before relying on automated failover.
Frequently asked questions
Is a successful TCP connection enough for proxy uptime?
No. It proves only one stage. Authentication, tunneling, destination TLS, response status, and content can still fail.
Should monitoring show average latency?
Keep a median and upper-tail percentiles by route, target, and window. A single average can hide intermittent delays.
How many failures should trigger failover?
Choose a threshold from the application’s detection and false-alarm budget. Validate it through a controlled exercise rather than copying a universal number.
Should a monitor retry HTTP 429 through another proxy?
No. It is destination pacing feedback. Slow down and follow the destination’s guidance instead of evading the limit.
Can a successful retry erase the first failure?
No. Retain both observations. Otherwise retry behavior hides emerging instability.
When should traffic return to the primary?
After sustained health, route verification, and a controlled canary satisfy the separately documented return criteria.
A measured route case study
See the dated Mexela proxy timing and sampled stability case study for a reproducible owned-target procedure, per-route median and p95 results, retained failed attempts, and a downloadable sanitized observation record. Its fixed observation window describes selected requests; it does not establish continuous uptime or performance for every client, location, destination or plan.
How should planned maintenance appear in proxy monitoring reports?
Keep the raw probe outcomes and annotate the declared maintenance window separately. State whether any availability calculation includes or excludes that window and preserve the denominator. Otherwise two reports can show different percentages from the same observations while hiding the methodological difference. A successful retry must not erase the original failed probe.
For the related implementation or diagnosis, inspect a measured route case study and its limits.